Arapua Labs — Results (SAR / AOT)
Period analyzed: 2024-05-15 → 2024-09-15. This page explains the layers, metrics, and hypotheses before you open the interactive Web Map.
Summary: Between Mar–Jun/2024, lagoon area increased by 37.3% (from 453.8 to 623.2 km²).
Key Metrics
Lagoon area — wet season
623.2 km²
Lagoon area — dry season
453.8 km²
Δ Lagoon Area
+169.4 km²
Migration speed (90% of active dunes)
30 m/yr
Overall motion speed (median)
0 m/yr
Mean migration direction
SE
Derived from Sentinel-1 (VV/VH) mosaics + Otsu + AOT
What you will see in the Web Map
Base maps
- CartoDB Positron — light, high-contrast labels for analytical layers.
- ESRI World Imagery — high-resolution optical background for visual context.
Analytical layers
- Lagoons — Wet season — polygons of water detected in peak rains (Jan–Jul). Dark blue.
- Lagoons — Dry season — residual lagoons in dry months (Aug–Dec). Light blue.
- Offset vectors — displacement arrows from AOT showing dune motion.
- Vectors (> 20 m/yr) — subset highlighting the most mobile dunes.
Legend — Dune migration speed (m/yr)
≤20
≤40
≤80
≤120
>120
Bins group vectors by annual speed so reviewers can quickly distinguish low-mobility interdune areas from fast-moving dune crests.
Results & Hypotheses
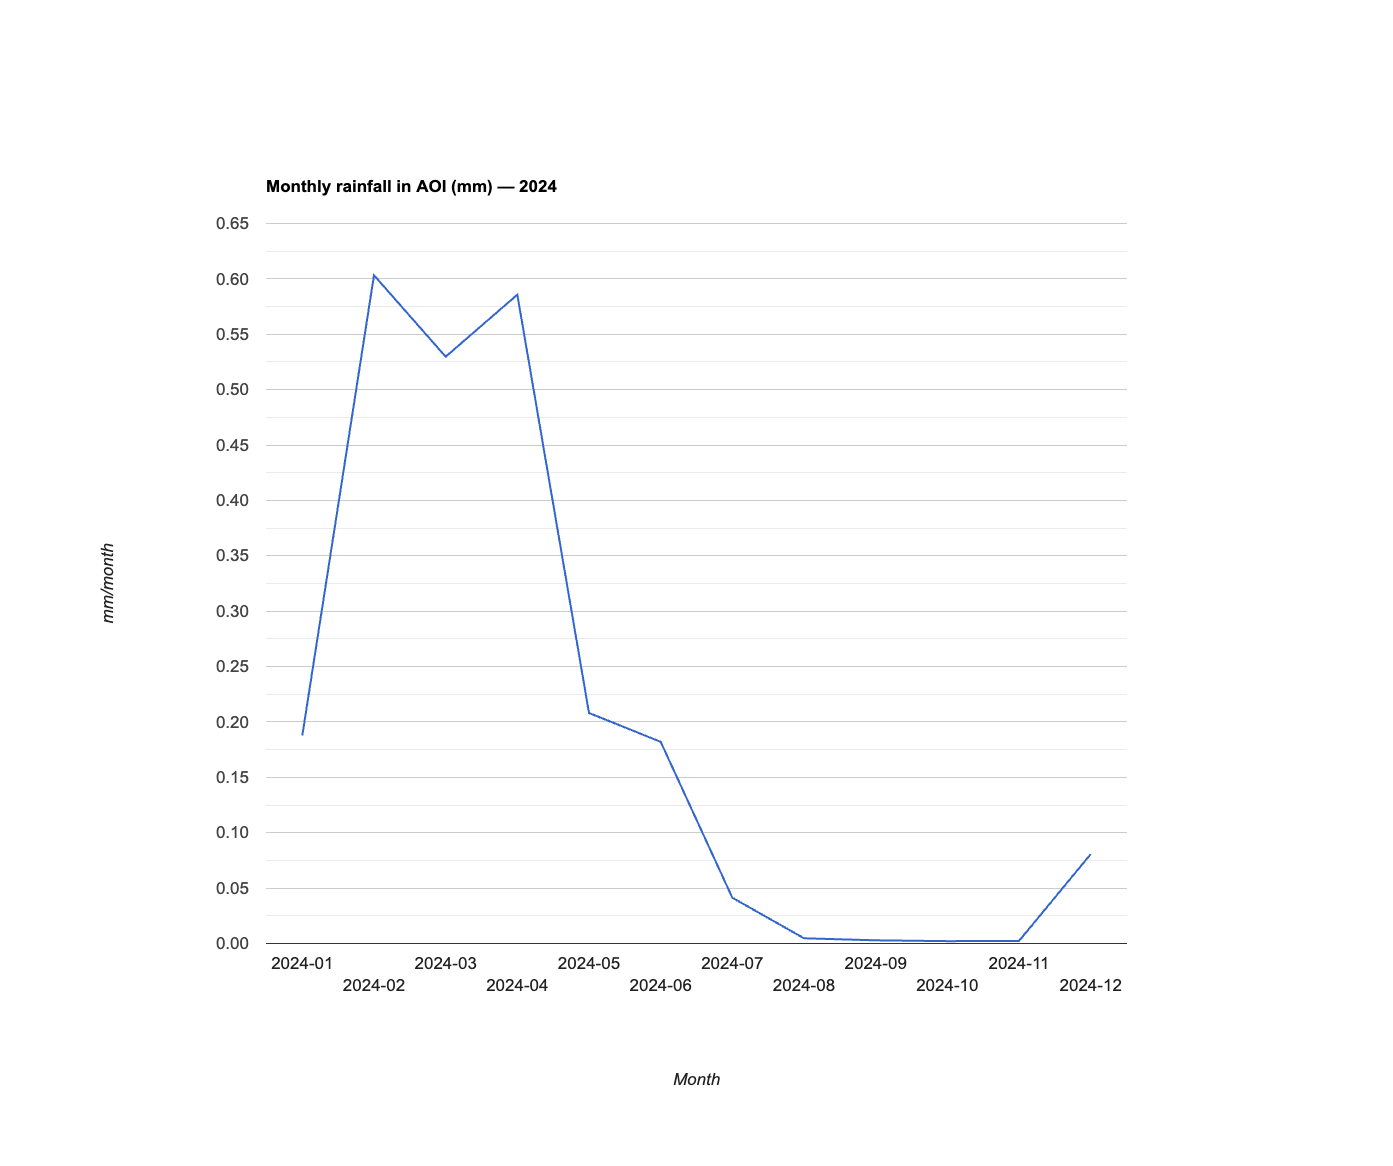
- Seasonal water pulse: wet-season SAR (VV) detects widespread lagoons; dry-season water recedes, exposing mobile sand.
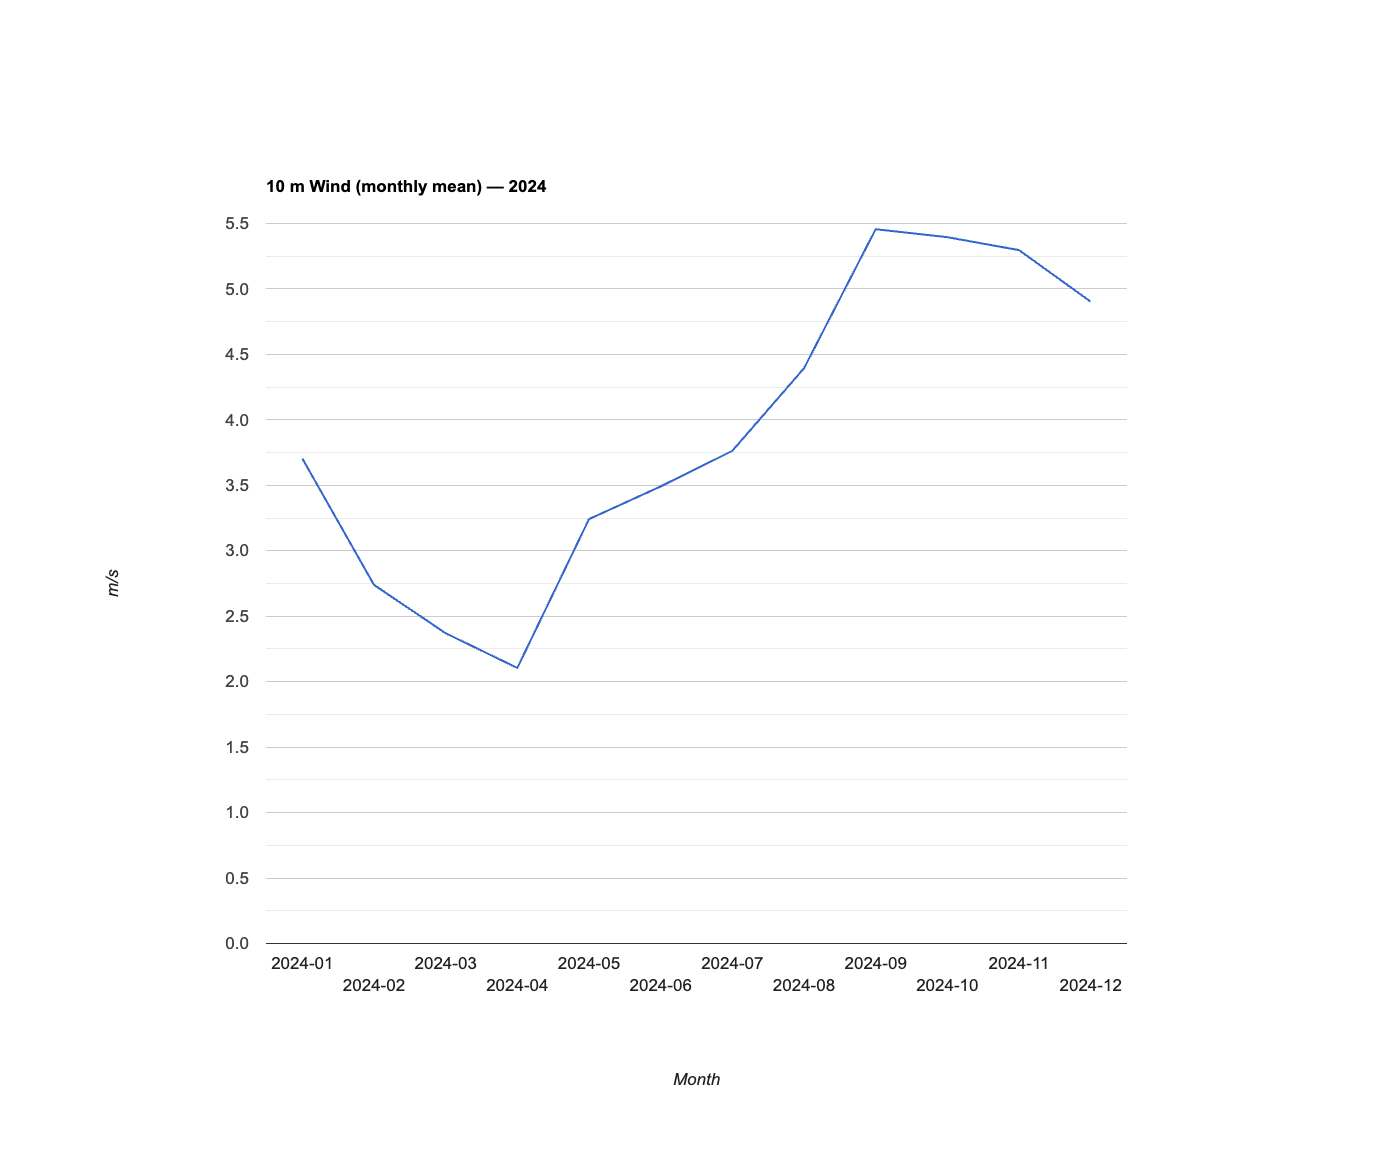
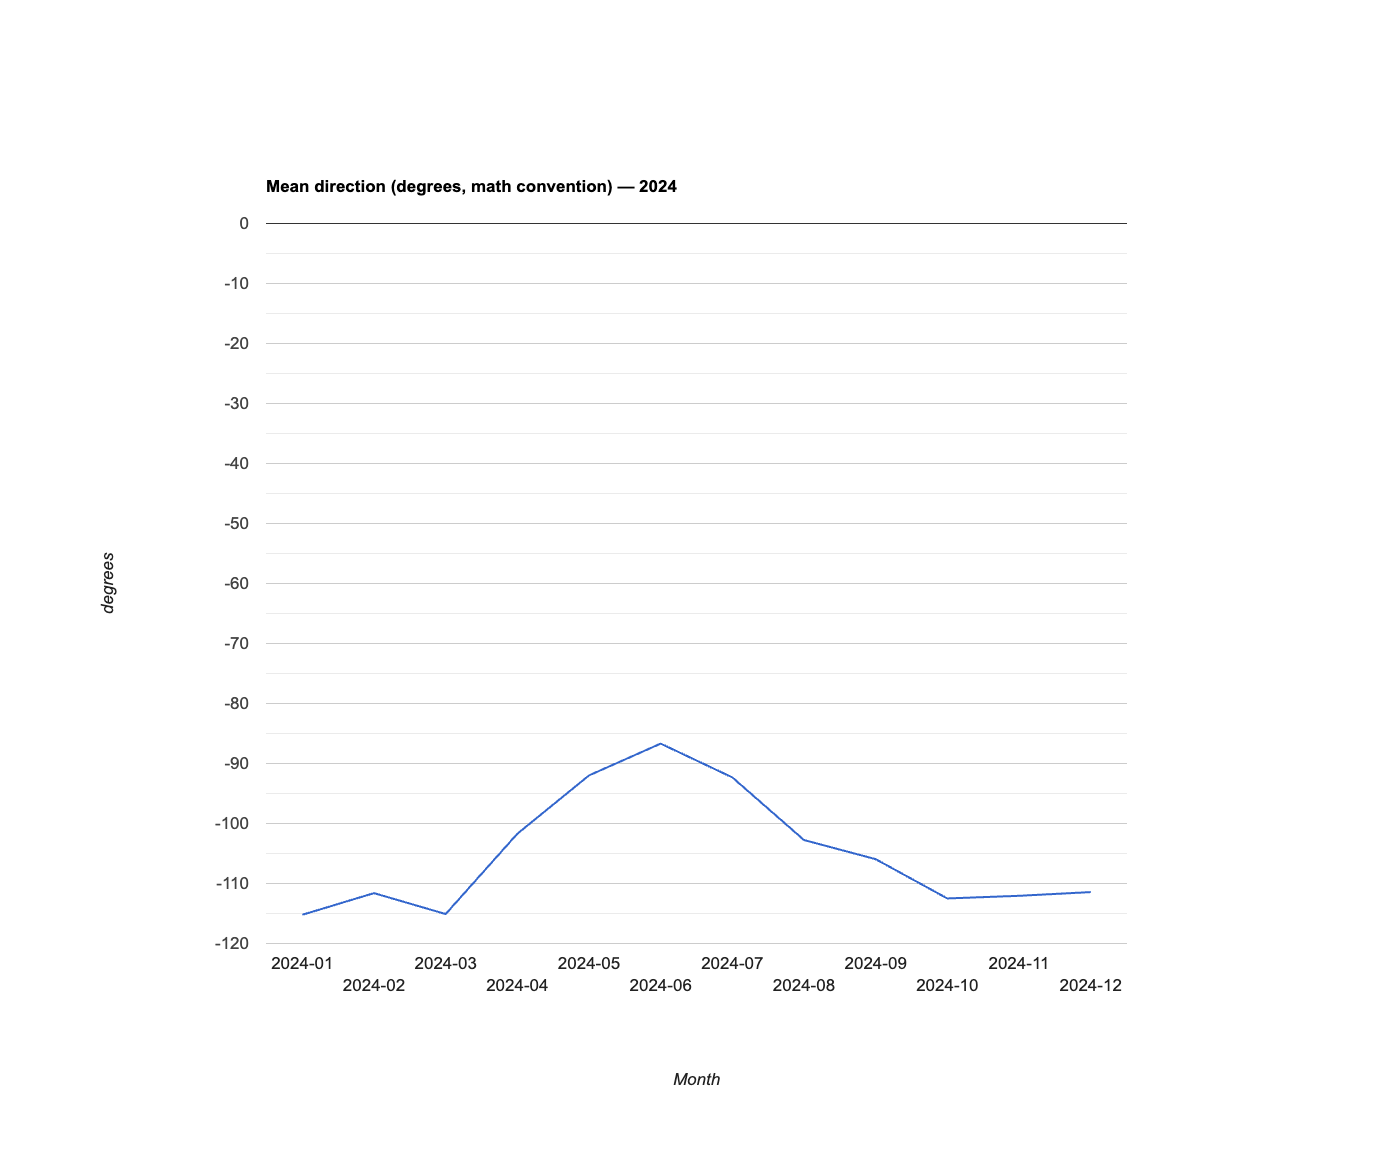
- Wind-driven migration: strongest NE trade winds in Jul–Dec align with vectors trending SE; AOT confirms crest-scale movement.
- Why median = 0 m/yr? Large parts of the AOI are low-mobility; using the median prevents bias from a few fast crests.
- Management insight: seasonal routing for tourism and water access planning could reduce isolation risks in Santo Amaro and Atins.
Charts